Project Management
Knowledge Management and M&E
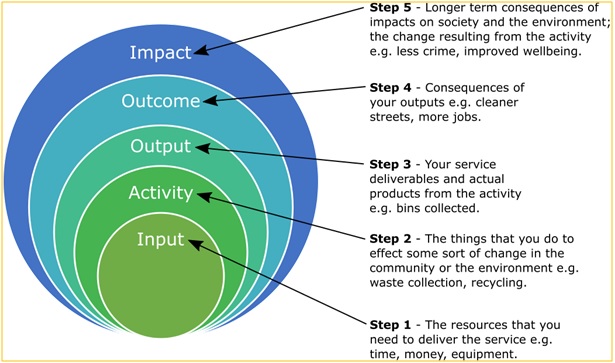
REAP
M & E System
Monitoring and evaluation (M&E) is a process that helps improve performance and achieve results. Its goal is to improve current and future management of outputs, outcomes and impact. A robust 24×7 online ILSP Management Information System (ILSP-MIS) under eGovernance of ILSP has been developed is being used as a tool for effective project implementation management. The objective of the tool is to collect reliable data and information for measuring performance and progress towards achievement of results; and to provide information about success and failures, so that corrective measures can be taken for successful implementation of project activities. It is also being used as a learning tool to provide information for critical reflection on project strategies and operations and supporting decision-making at various levels as a basis for results based management.
The project has developed (i) a participatory M&E and social audit system as an analytical tool to capture changes at the beneficiary level and also to assess the performance of service providers and TAs; (ii) an online/web based MIS; (iii) conducted evaluation studies (impact, AOS and KAP) to track project outcomes and assess impact; (iii) developed capacities for participatory M&E and the use of M&E information for project management for all staff at all levels – including the community and TAs; (iv) established a sound learning system for documenting lessons learned and best practices as a link to overall knowledge management in the project.
The agencies can monitor physical and financial progress and generate monthly and quarterly reports, which is being complied and analysed by the CPCU to generate the project report. Additionally, the agencies are supporting TAs to monitor their work and also undertake Participatory M&E and Social Audits at the community level. Monitoring of component outcomes at each agency level is being collaboratively undertaken by the CPCU with the use of quantitative and qualitative methods. The M&E data and information has been capturing and is being processed as part of the project MIS at the CPCU.
REAP
Project M&E Logical Framework
|
Results Hierarchy |
Indicators |
Means of Verification |
Assumptions |
|||||
|
Name |
Baseline |
Mid- Term |
End Target |
Source |
Frequency |
Responsibility |
||
|
Outreach |
1 Persons receiving services promoted or supported by the project |
Project monitoring |
Quarterly |
PMU/DPMU |
Project implementation undertaken without delay and with adequate release of financial resources |
|||
|
Males |
||||||||
|
Females |
240000 |
336000 |
||||||
|
Young |
264000 |
403200 |
||||||
|
Not Young |
||||||||
|
Indigenous people |
52000 |
117600 |
||||||
|
Non-Indigenous people |
||||||||
|
Total number of persons receiving services |
480000 |
672000 |
||||||
|
Male |
||||||||
|
Female |
||||||||
|
Young |
||||||||
|
1.b Estimated corresponding total number of households members |
Project monitoring |
Quarterly |
PMU/DPMU |
|||||
|
Household members |
1960000 |
2744000 |
||||||
|
1.a Corresponding number of households reached |
Project monitoring |
Quarterly |
PMU/DPMU |
|||||
|
Women-headed households |
||||||||
|
Non-women-headed households |
||||||||
|
Households |
400000 |
560000 |
||||||
|
Project Goal Contribute to the doubling of income of rural households and reduce distress rural out migration |
Percentage of households reporting increase in income by 35% above baseline |
Impact Assessment |
At baseline, midterm and completion |
PMU |
Sustained Government policies in favour of rural income enhancement with improved terms of trade for rural producers |
|||
|
Results Hierarchy |
Indicators |
Means of Verification |
Assumptions |
|||||
|
Name |
Baseline |
Mid- Term |
End Target |
Source |
Frequency |
Responsibility |
||
|
Households |
25 |
70 |
||||||
|
Percentage of returnee migrants supported |
Impact Assessment |
At baseline, midterm and completion |
PMU |
|||||
|
Households |
15 |
30 |
||||||
|
Development Objective To build resilience of rural households by diversifying their sources of income through intensified cluster based climate resilient production systems, promotion of farm and off-farm enterprises and creating a supportive ecosystem |
3.2.2 Households reporting adoption of environmentally sustainable and climate-resilient technologies and practices |
Impact Assessment |
At baseline, midterm and completion |
PMU |
Government’s infrastructure and other development efforts converge with this project activities. |
|||
|
Total number of household members |
||||||||
|
Households |
20 |
50 |
||||||
|
Males |
||||||||
|
Females |
||||||||
|
Young |
||||||||
|
Indigenous people |
||||||||
|
Women-headed households |
||||||||
|
Households |
||||||||
|
Percentage of rural enterprises reporting increases in income |
Impact Assessment |
At baseline, midterm and completion |
PMU |
|||||
|
Households |
25 |
70 |
||||||
|
Results Hierarchy |
Indicators |
Means of Verification |
Assumptions |
|||||
|
Name |
Baseline |
Mid- Term |
End Target |
Source |
Frequency |
Responsibility |
||
|
Outcome Agriculture production of rural households intensified and farm ,off-farm and non farm enterprise promoted, employment opportunities created |
SF.2.1 Households satisfied with project-supported services |
Annual Outcome Survey |
Annual |
PMU |
Adequate capacity is built within UGVS to address the needs of Producer Organizations and rural entrepreneurs and extreme climatic events do not disrupt agriculture production, |
|||
|
Household members |
||||||||
|
Non-indigenous households |
||||||||
|
Indigenous households |
||||||||
|
Non-women-headed households |
||||||||
|
Women-headed households |
||||||||
|
Households (%) |
||||||||
|
Households (number) |
||||||||
|
SF.2.2 Households reporting they can influence decision- making of local authorities and project-supported service providers |
Annual Outcome Survey |
Annual |
PMU |
|||||
|
Household members |
||||||||
|
Non-indigenous households |
||||||||
|
Indigenous households |
||||||||
|
Non-women-headed households |
||||||||
|
Women-headed households |
||||||||
|
Households (%) |
||||||||
|
Households (number) |
||||||||
|
Percentage of new or improved rural producers’ organization members reporting services provided by the organization |
Annual Outcome Survey |
Annual |
PMU |
|||||
|
Members RPOs |
50 |
90 |
||||||
|
Results Hierarchy |
Indicators |
Means of Verification |
Assumptions |
|||||
|
Name |
Baseline |
Mid- Term |
End Target |
Source |
Frequency |
Responsibility |
||
|
Percentage of households reporting increase in marketable volumes |
Annual Outcome Survey |
Annual |
PMU |
|||||
|
Households |
20 |
60 |
||||||
|
Output Cluster based agricultural production supported |
% increase in members under cluster based production |
Project Monitoring |
Quarterly |
PMU/DPMU |
||||
|
Increase in hectares |
20 |
40 |
||||||
|
No. of farm households trained in climate adaptive production practices and/ or technologies |
Project Monitoring |
Quarterly |
PMU/DPMU |
|||||
|
No. of farm households |
100000 |
400000 |
||||||
|
1.1.3 Rural producers accessing production inputs and/or technological packages |
Project Monitoring |
Quarterly |
PMU |
|||||
|
Males |
||||||||
|
Females |
||||||||
|
Young |
||||||||
|
Indigenous people |
||||||||
|
Total rural producers |
100000 |
250000 |
||||||
|
No. of ultra- poor households supported with Income generating activities |
Project Monitoring |
Quarterly |
PMU/DPMU |
|||||
|
Males |
||||||||
|
Females |
||||||||
|
Households |
6000 |
10000 |
||||||
|
Output Farm, Off-farm and non-farm Rural MSMEs promoted with linkages to BDS and technical and marketing services |
2.1.1 Rural enterprises accessing business development services |
Project Monitoring |
Quarterly |
PMU/DPMU |
Sustainable and qualified business service providers are available to provide access to services |
|||
|
Size of enterprises |
||||||||
|
Rural enterprises |
10000 |
35000 |
||||||
|
Males |
||||||||
|
Females |
||||||||
|
Indigenous people |
||||||||
|
Results Hierarchy |
Indicators |
Means of Verification |
Assumptions |
|||||
|
Name |
Baseline |
Mid- Term |
End Target |
Source |
Frequency |
Responsibility |
||
|
Young |
||||||||
|
Women in leadership position |
||||||||
|
No. of self employed enterprises established through skills training, apprenticeships and value chain entrepreneurship |
Project Monitoring |
Quarterly |
PMU/DPMU |
|||||
|
No. self employed enterprises |
23000 |
50000 |
||||||
|
Outcome Capacity for CBOs and partnerships strengthened |
Percentage of Rural producer organisations (CLFs, LCs, FPOs) financially profitable and sustainable |
Annual outcome surveys and evaluation studies |
Baseline; Completion |
PMU |
Sustainable and qualified business service providers are available to provide access to services |
|||
|
% Rural POs |
25 |
80 |
||||||
|
Output Supportive institutional structures strengthened |
2.1.3 Rural producers’ organizations supported |
Project Monitoring |
Quarterly |
PMU/DPMU |
Rural Producers organization and Producer Groups able to manage production, value addition and marketing activities efficiently and rural entrepreneurs able to access efficient BDS, credit, technical and marketing services |
|||
|
Total size of POs |
||||||||
|
Rural POs supported |
696 |
696 |
||||||
|
Males |
||||||||
|
Females |
||||||||
|
Young |
||||||||
|
Indigenous people |
||||||||
|
Women in leadership position |
||||||||
|
No. of farmers, women and youth trained in business and marketing |
Project Monitoring |
Quarterly |
PMU/DPMU |
|||||
|
No. of farmers |
5000 |
15000 |
||||||
|
youth |
||||||||
|
Women |
||||||||
|
No of youth supported through Rural incubation programme |
Project monitoring |
Quarterly |
PMU/DPMU |
|||||
|
Results Hierarchy |
Indicators |
Means of Verification |
Assumptions |
|||||
|
Name |
Baseline |
Mid- Term |
End Target |
Source |
Frequency |
Responsibility |
||
|
Young |
400 |
1000 |
||||||
|
No. of productive partnerships established with private sector partners by FPOs |
Project Monitoring |
Quarterly |
PMU/DPMU |
|||||
|
No. of partnerships |
50 |
130 |
||||||
|
Outcome Conducive enterprise promotion ecosystem promoted |
Percentage of multi stake holder platforms performing effectively |
Project Monitoring |
Quarterly |
PMU/DPMU |
Adequate interest exists within the community to create growth nodes for accessing sustainable services |
|||
|
% of platforms performing effectively |
40 |
90 |
||||||
|
1.2.6 Partner financial service providers with portfolio-at- risk ≥30 days below 5% |
Project Monitoring |
Mid-Term; Completion |
PMU/DPMU |
|||||
|
Percentage |
90 |
90 |
||||||
|
Output Support service established |
No. of growth centres established or strengthened |
Project Monitoring |
Quarterly |
PMU/DPMU |
Adequate interest exists within the community to create growth nodes for accessing sustainable services Banks remain interested to lend to SHGs/ PGs and livelihood collectives with facilitation from UPASAC and SRLM |
|||
|
No. of growth centres |
100 |
300 |
||||||
|
Output Policy products completed |
Number of policy-relevant knowledge products completed |
Project monitoring |
Quarterly |
PMU/DPMU |
||||
|
No. of policy |
4 |
6 |
||||||
|
Results Hierarchy |
Indicators |
Means of Verification |
Assumptions |
|||||
|
Name |
Baseline |
Mid- Term |
End Target |
Source |
Frequency |
Responsibility |
||
|
Output Financial services extended |
Number of MOUs with financial institutions |
Project Monitoring |
Quarterly |
PMU/DPMU |
Banks remain interested to lend to SHGs/ PGs and livelihood collectives with facilitation from UPASAC and SRLM Financial institutions remain interested to lend to enterprises |
|||
|
No of MoUs |
4 |
8 |
||||||
|
Number/% of SHGs/ PGs and livelihood collectives/FPOs with bank loans |
Project Monitoring |
Quarterly |
PMU/DPMU |
|||||
|
No, of SHGs/ PGs |
30000 |
50000 |
||||||
|
% of SHGs/ PGs |
||||||||
|
Number of micro and small enterprises availing bank credit |
Project Monitoring |
Quarterly |
PMU/DPMU |
|||||
|
No. of enterprises |
5000 |
10000 |
||||||